
Research
Updated September 11, 2026
From plumes to people
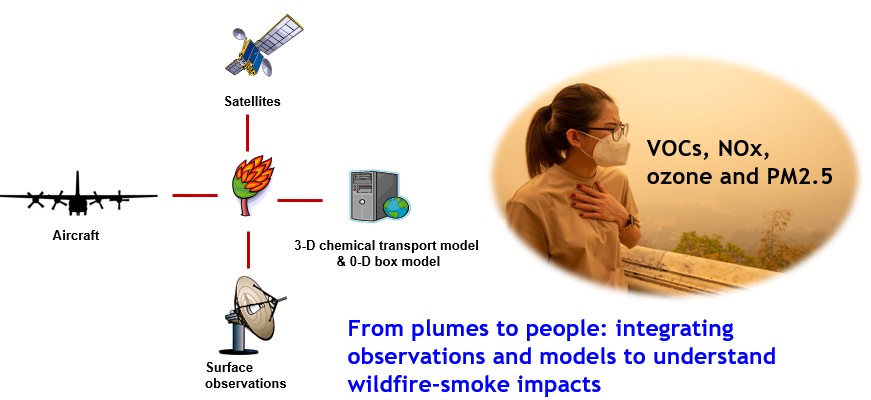
Wildfire smoke changes as it travels. What fires emit, how those emissions react, and where the smoke goes all shape the pollution people breathe. I combine aircraft, surface, and satellite observations with chemical box models and three-dimensional atmospheric models to follow that journey.
1. How much do western U.S. wildfires emit?
In our western U.S. tests, three fire inventories generally detected the large fires sampled by aircraft, yet simulated fire-related increases in carbon monoxide (CO) and several directly emitted volatile organic compounds (VOCs) were only about one-third to one-seventh as large as observed. Finding the fires was not enough to quantify the gases they released.
I test these estimates by combining satellite-derived fire inventories, aircraft observations of fresh plumes, ground measurements of aged smoke, and GEOS-Chem sensitivity simulations. The model’s 14 biomass-burning VOC groups accounted for only about half of the total VOC-to-CO emission ratio measured across 161 compounds. After accounting for both gaps, we estimated that wildfires supplied about 45% of western U.S. primary VOC emissions during the active 2018 fire season.
Increasing emissions alone does not fix every pollutant. In a separate aged-smoke test, tripling modeled biomass-burning VOC and CO emissions improved several gases but could not correct gases and PM₂.₅ at the same time.
Related publications. Jin et al., 2023, ACP (paper) · Jin et al., 2026, ACP (paper)
2. How quickly does smoke chemistry change?
Smoke can react at very different rates from one fire to another. Across five selected daytime plumes, chemical age explained 40–70% of the between-plume variation in VOC loss and ozone and PAN formation. At least two plumes began under VOC-limited or transitional conditions and moved toward NOₓ-limited conditions as they aged.
I combine aircraft and ground observations with chemical box models and three-dimensional models to track these changes. Chemical clocks reveal how much oxidation the smoke has experienced. In a separate Missoula aged-smoke case, GEOS-Chem OH exposure was about twice the value inferred from ground-based chemical clocks, and the model underestimated several oxygenated VOCs.
These comparisons test whether models capture both the initial wildfire VOC mixture and its evolution downwind.
Related publications. Jin et al., 2026, Science Advances (paper) · Jin et al., 2026, ACP (paper)
I am now extending this plume-scale work to regional ozone using satellite and surface observations, trajectory analysis, and CMAQ.
3. Which wildfire VOC chemistry is missing from reduced models?
Aircraft-constrained modeling identifies furanoids—together with acrolein and 1,3-butadiene—as important contributors to VOC reactivity that are omitted or simplified in reduced chemical mechanisms. At the sampled plume centers, a detailed gas-phase mechanism reproduced much of the inferred OH and observed ozone behavior when supplied with a fuller VOC mixture. Better VOC representation can therefore improve predictions of smoke oxidation and secondary pollution.
My ongoing work examines how furanoid oxidation affects oxygenated VOCs, glyoxal, and secondary organic aerosol from plume to global scales. I combine laboratory-derived aerosol yields, explicit chemical-mechanism development, aircraft constraints, and global chemical transport modeling.
Published foundation. Jin et al., 2026, Science Advances (paper) · Permar et al., 2023, Environmental Science: Atmospheres
Project outputs. AGU 2024 abstract · IGC11 slides · Furanoid mechanism manuscript in preparation
4. What did multi-day smoke bring to Missoula?
During September 2020, much of the regional smoke reaching Missoula had spent several days traveling and reacting, although smaller nearby fires may also have contributed. During smoke periods, CO, fine particulate matter (PM₂.₅), and measured VOCs were 2–8 times their background levels.
I combined long-term air-quality records, hourly measurements of 75 VOCs, chemical transport modeling, and toxicity-based exposure metrics to examine what this smoke brought to the city. In an upper-bound screening scenario that assumed a person experienced a 2020-like smoke season every year for 70 years, PM₂.₅ accounted for about 90% of the estimated cancer risk. Measured hazardous gases dominated the chronic noncancer risk estimate.
These are screening estimates, not measurements of illness. They show why assessing particles and gases together gives a fuller picture of wildfire-smoke exposure.
Related publication. Jin et al., 2026, ACP (paper)
If you are interested in collaboration on wildfire emissions, smoke chemistry, satellite integration, atmospheric modeling, or exposure and health applications, please use my contact page.